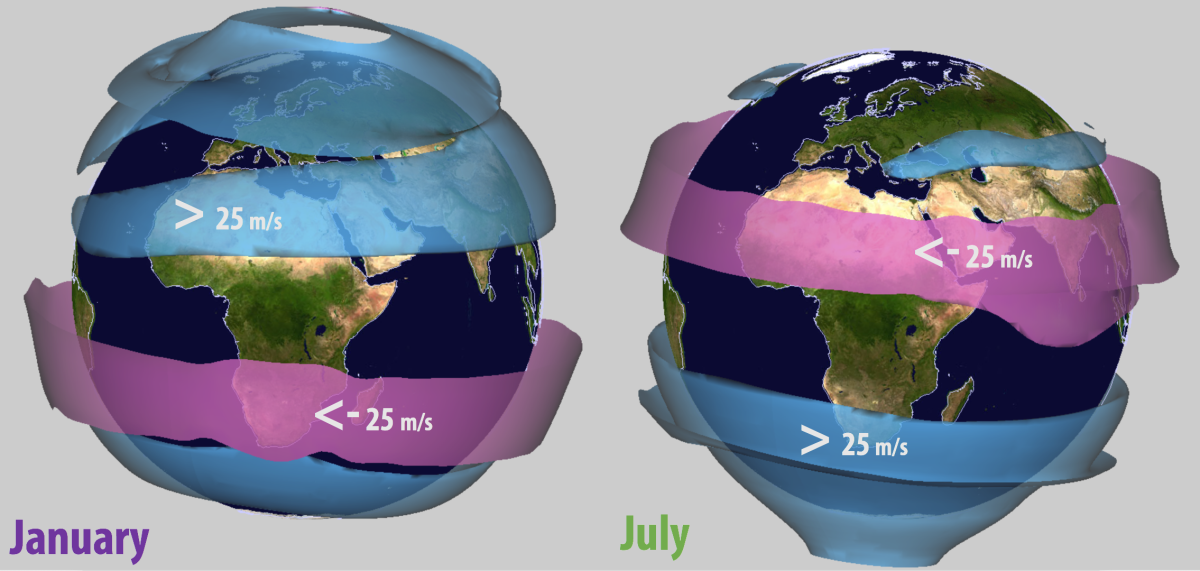
“With Lodovica [Illari] and Bill [McKenna], we are trying to reimagine how human beings will navigate around the world,” says artist Tomás Saraceno, describing the lofty goal of his Aerocene project. These emission-free floating sculptures, made from silver and transparent Mylar, are designed to travel around the earth without helium, batteries or solar panels. Instead, they glide on wind currents and are kept afloat by solar and infrared radiation. “There are highways in the sky; the jet stream moves at a speed of 300km per hour,” Saraceno points out, “but first, you need to know where the jet stream is.” With this knowledge, Saraceno hopes to change the laws of aviation and mitigate the impact of big fossil fuel burners. But the air-fueled sculptures are not merely designed for utilitarian purposes; they are works of art, which Saraceno explains, prompt us to “speculate on how mobility shapes the way we live on the earth.”
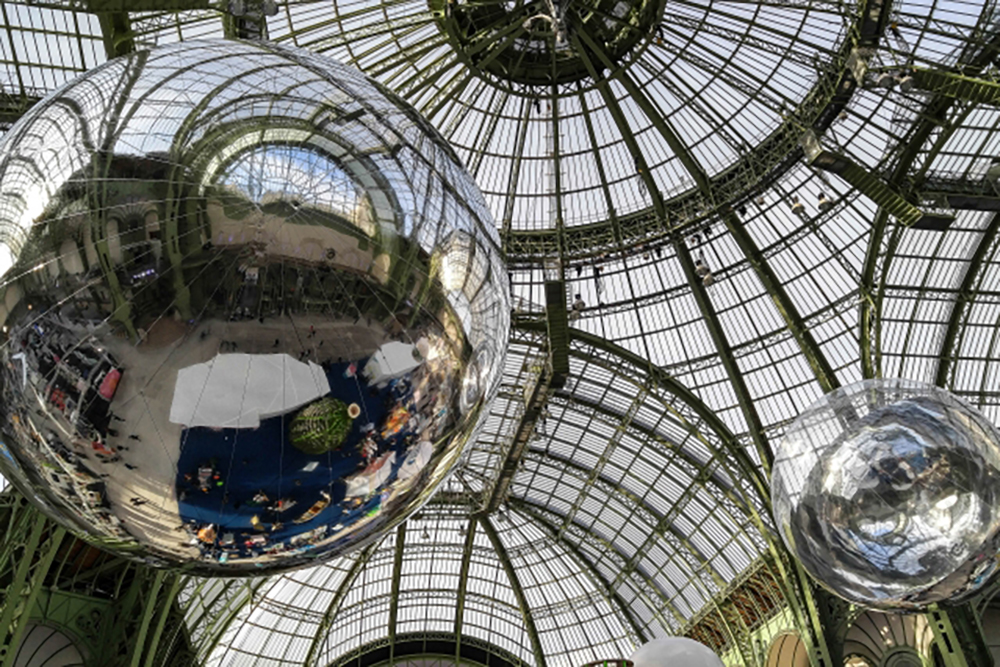
For the past year, Saraceno has collaborated with MIT meteorologist Lodovica Illari and Bill McKenna, a researcher in her lab in the Department of Earth, Atmospheric and Planetary Sciences (EAPS), to study the jet stream and determine potential flight paths for his aerosolar inflatables. They presented their work at COP21, during the climate summit in Paris in December 2015, where Saraceno’s sculptures were suspended from the glass and steel ceiling of the Grand Palais. McKenna—who worked with Saraceno on many phases of the project, in Cambridge, the Solomon Islands and Paris—shares his impressions and insights into the Aerocene’s development at and beyond MIT, and on and above terra firma.
Interview with Bill McKenna (from edited excerpts)
When did you first meet Tomás, and how did you become involved in collaborating on the Aerocene project?
At the unveiling of MIT’s Center for Art, Science & Technology (CAST) in 2012, Tomás spoke of his work as the inaugural artist in residence. From cosmic structure to spider webs, he was translating structure across scales, making theories perceptible to human senses in ways that connect people into a novel whole. I was in the audience, writing a whole novel, when my pen began to run out of ink …
A year later, Tomás came to visit Lodovica Illari, a climatologist and Senior Lecturer in Synoptic Meteorology in EAPS. I was assisting in the lab, spinning up Weather in a Tank—a set of rotating fluids experiments designed to evidence the effect of planetary rotation on atmospheric phenomena. The tables turned, we were able to give Tomás our best look into dynamics of large scale weather systems on Earth by using water on the smaller rotating table.
Tomás was intrigued by the fluids’ behaviors: these world-round circulations were the flows on which he wanted to fly. His experiments had already lifted him into the air by sun, to become aerosolar, and with the scientists of CNES in France, he was learning how to stay airborne night & day with the Earth’s radiation. He was imagining sculptures mapping thermodynamic gradients in their movements, catching or reflecting incident radiation like clouds, broadcasting the data to people all over the globe.
These floating ideas coalesced into a collaboration that took on real scope in the last year with the study of flight data from CNES’s Montgolfier Infrarouge (MIR)—the Aerocene project for COP21 in Paris.
You have a degree in architecture (BSc Architecture MIT ’10) and now work on visualizations of geophysical fluid dynamics for Lodovica Illari’s lab. Could you elaborate on your role in EAPS and your evolving research interests?
Building up a three-dimensional understanding through contours and elevation is second nature to an architect. In the rotating fluid lab, the challenge is that the whole system is spinning and the form is changing. I am fascinated with how render these fluid subjects, how to bring views together across rotating reference frames into dynamic plan and section. I did this at first with software I learned as an undergrad for design and electronic music. Crossing fields, I came across a graphics package from Unidata, Integrated Data Viewer [IDV], which gave me the tools to explore the evolving three-dimensional structures of wind motions. I dived in, creating endless visualizations.
Collaborating with Lodovica Illari of EAPS has been vital to understanding what’s occurring in the real atmosphere, and how to choose the best lens to view large-scale or local phenomena. Together, we assembled a set of visualizations of fundamental phenomena in the atmosphere: fronts and jet streams, tradewinds and turbulent weather systems. They are intended to teach students and the public the basic aspects of the general circulation of the atmosphere.
Did working with Tomás affect the way you might approach your own data visualizations (or your other work) in future?
Certainly. I had been immersed in studying the structure of the atmosphere as forms, cyclically recurring topologies. I had studied at length tracks of paper dots wandering in the rotating tank, but sharing work in-conversation with Tomás, I began to consider how strands would behave over eddying scales, what designs could be assembled by convergences in the flow. I had long wondered how to convey these atmospheric circulation patterns to public audiences in a more engaging way: dance, story, a song in rounds? The idea of the trajectory became important.
At a data storytelling event Datalore Hacks, co-sponsored by the MIT Center for Civic Media, I submitted a climatological dataset of air made fictitious with Coriolis effects, along with a lyric from my friend Jamal River as King Toad:
“All the air you’ve been breathing out, it has circled around the world/
And all the time you’ve just been standing here, well your breath’s already seen the world..”
Our team made a web interface to explore the story of our breath leading up to the event. In the prototype hack, we could move a little spark of forward with our breath (or tapping a tempo on the mic), and the map would pop-up user-submitted content, like photos, videos, art about the environmental issues impacting the places it moved through. The trajectory of the journey was computed in reverse from Boston using wind data averaged over 30 years.
In a later meeting, Tomás discussed with me ‘the overview effect’: the consciousness change many astronauts describe as they experience the earth as viewed in orbit. The stratospheric levels, where long-duration flight is permitted are well above where planes fly, but still suborbital. I started to calculate what one could see at those heights in the stratosphere. By what geometry are the horizons defined? What is the Aerocene, circumnavigating Earth, rising up and sinking down?
You recently traveled to the Solomon Islands with Tomás and a group of researchers. What were some of the goals of that trip, and what was a typical day? (Or an atypical day?)
I experienced less than an hour of August 7th before passing the international dateline, east to west. The plane crossed into the Southern Hemisphere about an hour before, so I am not sure if that equals Aug. 6, 7, or 8th, but we had all gathered by the 9th, welcomed kindly in the Solomons.
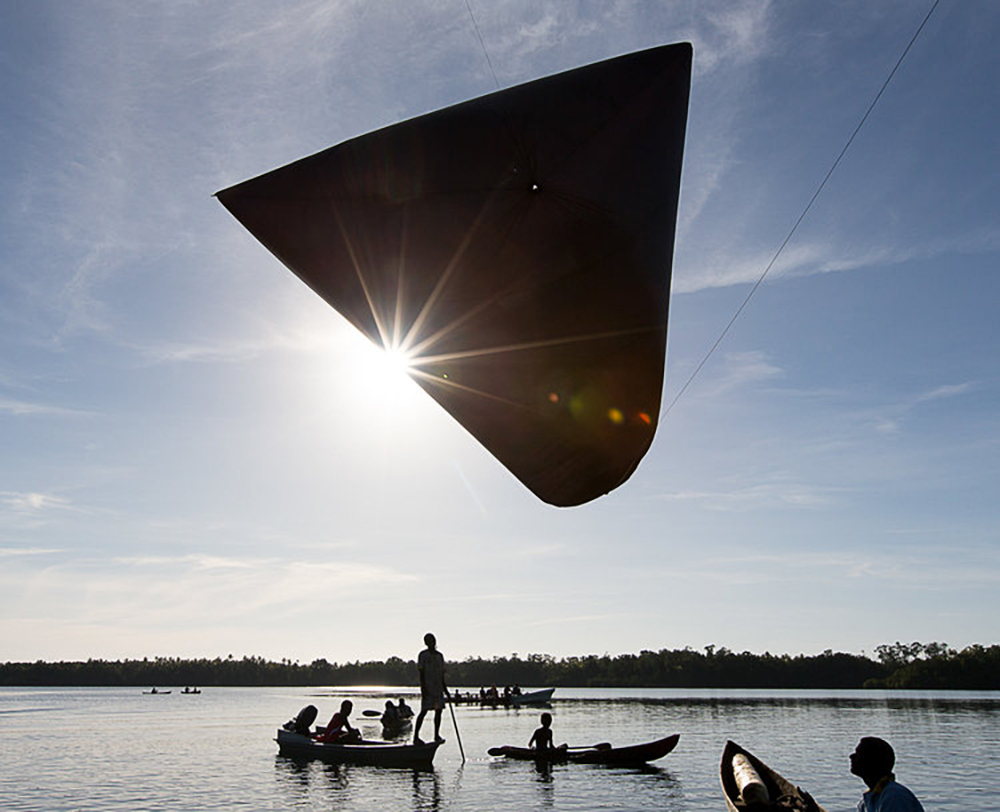
Kindness was a continuity extending out to the Dardanella at sea. The Dardanella is TBA21 Academy’s research vessel; it travels the oceans, hosting artists and scientists, experimenting with interdisciplinary models and ecologic outreach. Many people convened there in August 2015, from west to east, to develop the Aerocene. We did launch (and pursue by boat) a solar sculpture made by Tomas for the event. It was my first time working with a solar balloon; I have helped construct inflatables on land but never with liftoff in mind. The timing of the launch was dictated by the local weather at this latitude of 8.25°S.
The Solomon Islands have four seasons, two rainy and two dry, exceptional to many tropical locations. Solomon Islanders had experienced an out-of-season cyclone not long before we joined them in August 2015. We kept a close eye on the forecast—we wanted good weather for our solar balloon’s release.
The sea environment presented a set of challenges for these early Aerocene prototypes; the coolest mornings were good for launch because the atmosphere was quiet and there was no convection in sight. However, mornings were the time of day with the most dew from the persistent humidity. The first sculpture of biodegradable material became quick muck with contact moisture and the growing heat of its interior air; we decided to launch the other in a tethered flight, but it broke free one beautiful morning, in an inlet at Kukudu. I felt rewarded when I saw it flying in the sky….
What part of the Aerocene project did you work on at MIT? What did you/EAPS contribute to the exhibition at COP21?
I synthesized flight data from the Montgolfier Infrarouge (MIR) from CNES with analyses of the atmosphere. The daily up and down variations of the craft across pressure levels presented new challenges. The highest altitude, lowest pressure observation points actually fell outside the datasets I was familiar. I was forced to think about an unfamiliar environment, far into the levels of the stratosphere.
Coincidently, William Randel from UCAR gave a lecture series at MIT [Houghton, summer 2015] on stratospheric dynamics and provided the scaffolding to expand my bounding box. His overview of the general circulation enriched my picture of upper troposphere, lower stratosphere interactions, where the ozone chemistry is important.
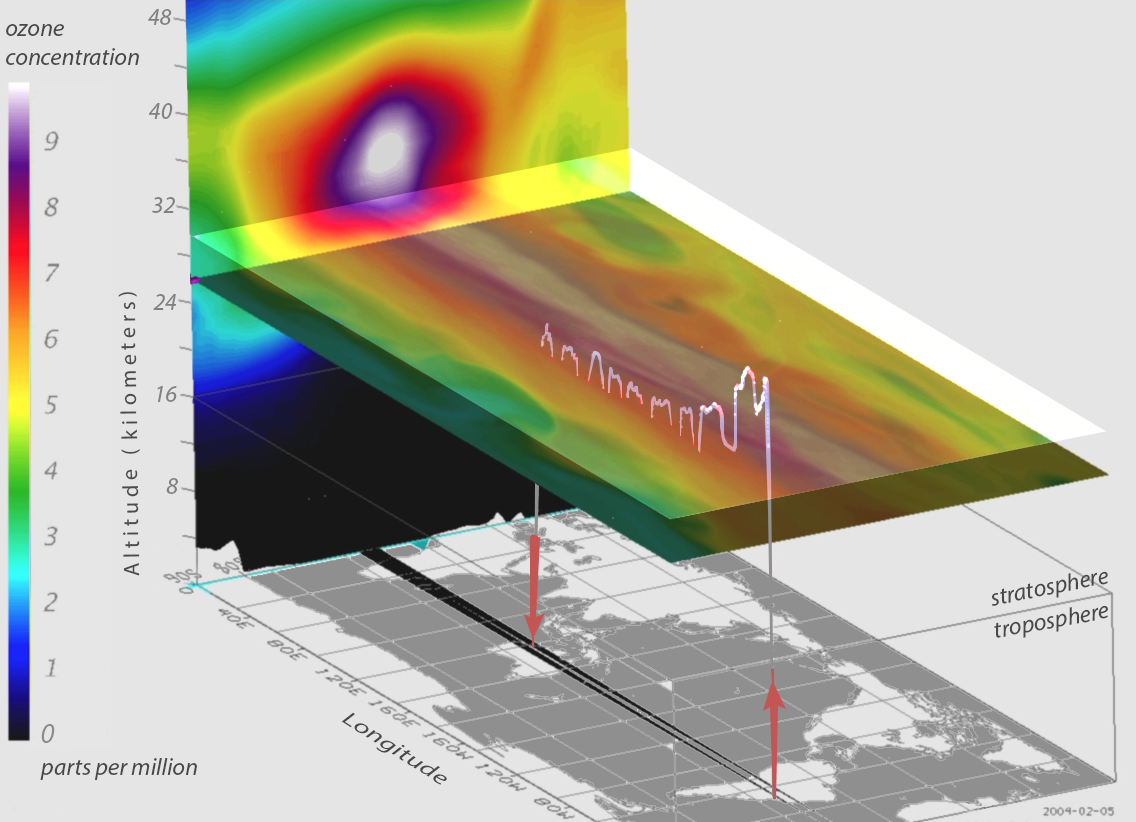
Thanks to an NSF Frontiers in Earth Science Dynamics project, led by Professor John Marshall, I began to look into the ozone hole through time—first looking at the seasonal variations in the Antarctic before widespread aerosol usage, then around the time aerosols and hydrofluorocarbons were regulated by policy with the 1997 Kyoto Protocol, and finally, years after resulting mitigations. As ozone depletion impacts air circulations, air circulations in turn change ocean currents.
For our COP21 study, the above ozone data was viewed in synchrony with the MIR flights. The structure in ozone’s daily production was explored in depth by taking a ride on the twice daily vertical soundings of the half-mirror MIR balloons. Since ozone is mostly conserved, it acts a a tracer carried with the flow, giving insight into the dynamics of the stratosphere.
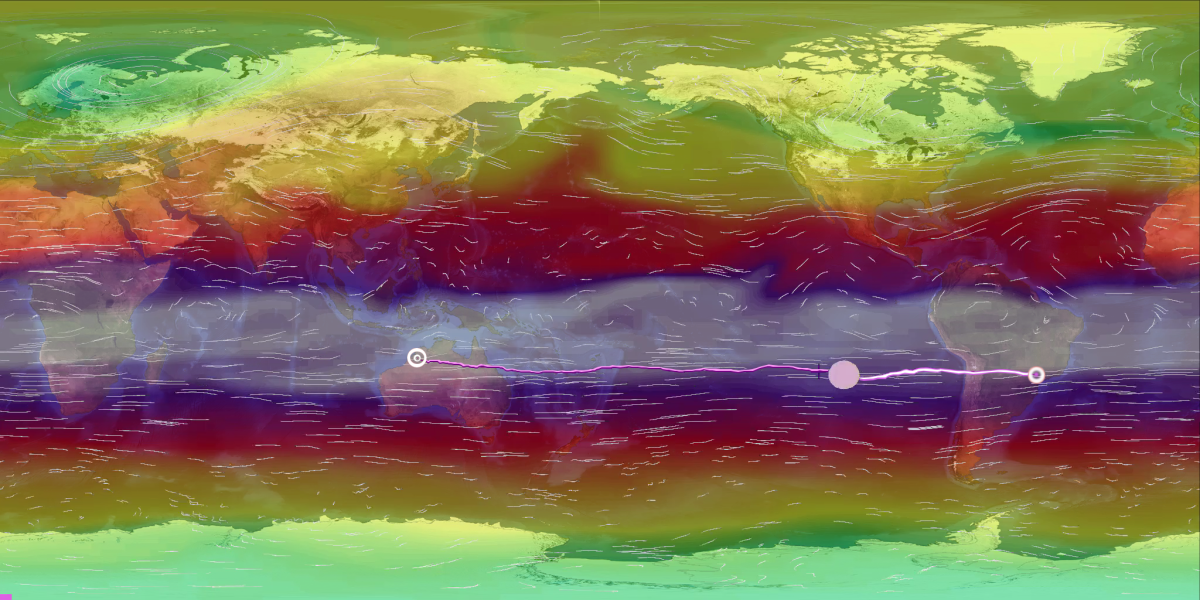
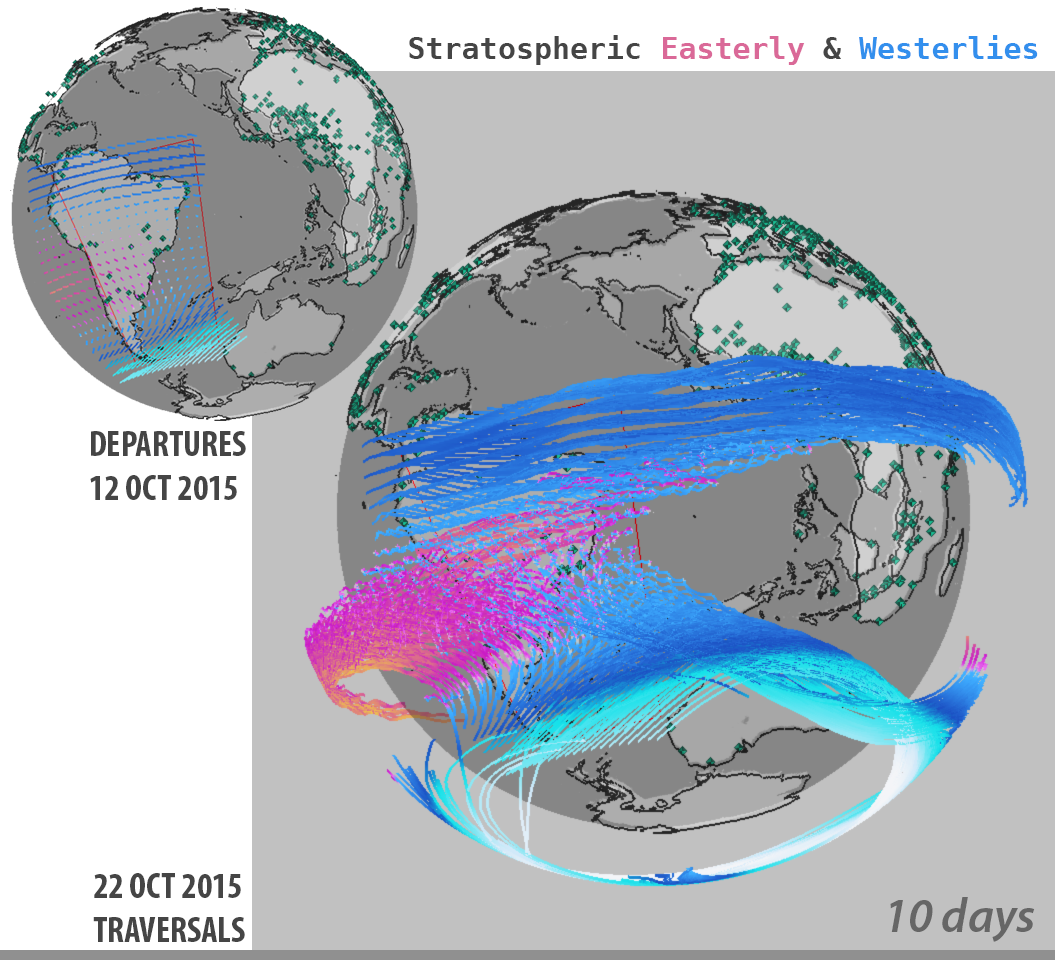
Working towards COP21, I also collaborated with Professor Glenn Flierl to make a visualization of earth’s wind currents that could capture the propagating planetary waves. We also used the computed trajectory to predict future travel. On the clock of the UN Conference of the Parties (COP21), we wondered what proportion of the globe could reach France by Aerocene in 10 days, winds willing.
For the aerosolar space agency, these travel studies help identify likely destinations, and how available destinations vary with launch time and location. This is an indispensable reference in planning the best start with the longest duration for the sculpture going up in 2018.
You were in Paris for the opening of the exhibition. Could you describe the exhibition and your general impressions of the COP21 climate forum? Any highlights?
As the United Nations were just setting the conditions for long-term, moving-target action, it was a rare opportunity to be at the Solutions COP21 exhibition at Grand Palais, ready to show a solution and a direction for research.
The model Aerocene, two sculptures by Studio Tomás Saraceno, flying overhead in mirror-Mylar, enabled a change in point of view: looking up into the reflected architecture of the Grand Palais, the Aerocene share with you the sky, and you are momentarily disoriented. You must decide whether to keep drifting through the projection map or to situate yourself somewhere on the sphere. Your view is unique, but no one is at center of these endeavors; instead we all work together in these larger spheres of interaction.
The accompanying symposium at the Palais de Tokyo, where Leila Kinney presented our work, was a combined working-session open to the public and collaborators. It was a true highlight to be able to meet all of the people who had been contributing to the project.
I was thankful for the opportunity to show a video I made of a global aerosolar forecast, which showed connections by jet stream from the northeastern US to near Paris for the weeks in November leading up to the symposium. After the panels, I gave those interested a closer look at the video and listened to their feedback. New friends asked questions about behaviors of particular paths, and I added my own theory and analogies to the conversation.
Do you have plans to continue to collaborate with Tomás?
I’d love to design an experience to unlock the oceans and atmospheres of data out there, to allow understanding of Earth and the fluids we share, to help build intuitions that provide for futures where we gather in fresh air. I think the tool we’re developing to punt the Aerocene around the globe will lend to that cause. I bet Tomás invites you to participate too.
This is the first post in an ongoing series, “Behind the Artwork,” in which MIT researchers who worked closely with CAST Visiting Artists share the personal stories, scientific insights and technological developments that went into developing their collaborative projects.